QU'EST-CE QUE TU CHERCHES?
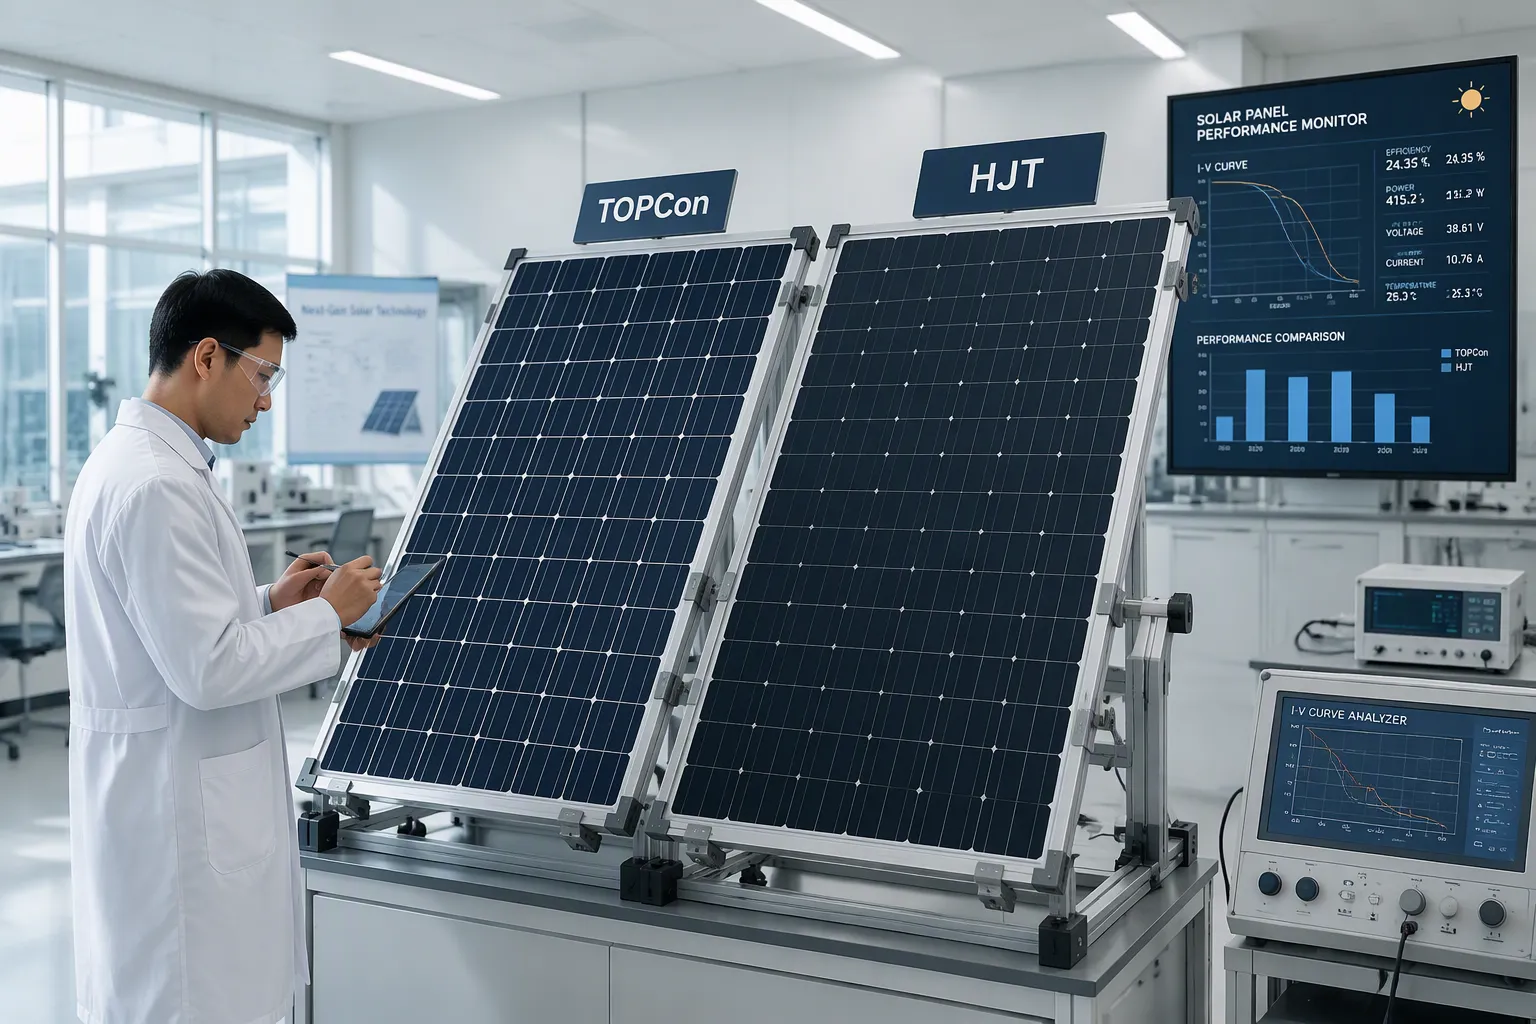
HJT leads on efficiency and temperature performance, with coefficients of -0.20% to -0.30% per degree Celsius. N-Type TOPCon, at -0.26% to -0.30%, offers mature, cost-effective mass production. This N-Type TOPCon vs HJT Solar Panels comparison weighs performance, degradation, cost, reliability, and application fit. Both are viable N-type architectures. Treat this as a decision tool, not a verdict.
HJT panels offer higher efficiency and better heat performance, but they cost more.
TOPCon panels are more affordable and widely available, making them a practical choice for many projects.
Your project's climate, space, and budget will determine which technology is the best fit.
The silicon wafer sets the foundation. P-type wafers carry boron as the dopant. N-type wafers use phosphorus instead. That single material choice drives most of the performance gap between the two families.
P-type silicon forms boron-oxygen complexes under sunlight. This light-induced degradation (LID) cuts initial output by 1%–3%. N-type silicon contains no boron, so it largely avoids LID. N-type cells also resist potential-induced degradation (PID) better. You get a more stable module from day one.
The gains show up in real numbers. Top N-type TOPCon and HJT modules reach 23%–24% conversion efficiency. Top P-type Mono PERC modules sit at 21.5%–22%. That 1%–2% edge means more power from the same roof or land area.
Heat matters too. N-type temperature coefficients run -0.29% to -0.32% per degree Celsius. P-type runs -0.34% to -0.37%. On a 55°C summer day, the N-type module keeps more of its rated output. Field data confirms this: N-type TOPCon delivers 8% more peak summer output per kW and retains 91% of output at 60°C versus 87% for P-type. Over 25 years, modeled energy per kW runs 11% higher. First-year degradation stays below 1%, compared with 2.1% for P-type. You collect more kilowatt-hours across the whole warranty period.
TOPCon is the most widely adopted N-type technology in mass production today. The numbers show why. By 2025, TOPCon capacity is projected at roughly 800–900 GW, against about 70–100 GW for HJT. In 2024, TOPCon's share of global new solar panel installations is expected to exceed 60%.
Market share: 65–80% for TOPCon, 8–12% for HJT
Mass-production line status: full mature for TOPCon, new line required for HJT
Market position: lowest LCOE utility for TOPCon, premium high yield for HJT
The process flow explains this scale. TOPCon adds a thin tunnel-oxide and doped polysilicon passivation layer to a PERC-style cell. Roughly 70–80% of TOPCon capacity comes from upgraded PERC lines. You get higher output without building a new fab, so supply is broad and lead times stay short.
HJT solar cell technology takes a different route. The cell sandwiches a crystalline silicon wafer between thin amorphous silicon layers. This structure passivates the surfaces well and needs fewer process steps at high temperature.
That design also demands new production lines. You cannot retrofit an existing PERC line easily, so HJT capacity stays smaller and carries a premium price. The payoff is a higher-efficiency cell with strong temperature behavior. When you weigh N-type TOPCon vs HJT, the manufacturing base is the clearest divider: TOPCon wins on availability, HJT on ceiling performance.
HJT sits at the top of the efficiency ladder. Cell efficiencies reach 25.5–27%, and module efficiencies land at 23–25%+. TOPCon cells run 24–26%, with modules at 22–24%+. The gap narrows once you move from cell to module.
|
Technology |
Cell Efficiency |
Module Efficiency |
|---|---|---|
|
N-Type TOPCon |
24–26% |
22–24%+ |
|
N-Type HJT |
25.5–27% |
23–25%+ |
That difference translates into roughly one percentage point at module level. On a space-limited roof, the extra point means more kilowatts from the same area. On an open field, it matters less.
Heat is where HJT pulls ahead again. HJT carries a temperature coefficient of about −0.24 to −0.26% per degree Celsius. TOPCon sits near −0.29% per degree Celsius. HJT also performs well in low-light conditions.
|
Technology |
Temperature Coefficient (Pmax) |
|---|---|
|
N-Type TOPCon |
~−0.29%/°C |
|
HJT |
~−0.24 to −0.26%/°C |
These values vary by manufacturer and product generation. Still, the pattern holds: HJT loses less output as panels heat up. For hot climates, that behavior supports stronger daily yield. TOPCon remains a solid performer, and its naturally higher bifaciality factor helps in snowy or sandy sites. HJT works well in bifacial designs too, capturing reflected light from the ground. Both technologies support bifacial configurations, so match the choice to your site conditions.
Output falls a little every year, and the rate compounds over the life of the array. HJT degrades more slowly than TOPCon. Published figures put HJT at roughly 0.25–0.40% per year and TOPCon at roughly 0.35–0.50% per year.
|
Technology |
Annual Degradation Rate |
25-Year Capacity Retention |
|---|---|---|
|
N-type TOPCon |
0.35–0.50% per year |
89.4–91.2% |
|
N-type HJT |
0.25–0.40% per year |
90.5–92.8% |
The gap looks small on paper. It adds up across decades of production. At year 25, a TOPCon module typically holds 87–89% of its original output, while an HJT module holds 90–92%. By year 30, the figures read 85–87% for TOPCon and 89–91% for HJT. On a large project, those percentage points become real megawatt-hours and real revenue.
Both technologies still beat P-type by a wide margin. N-type panels degrade roughly 30–50% less than P-type panels. That advantage delivers about 5–7% more energy yield over 25 years.
Warranty terms tell you how confident a manufacturer feels about its product. TOPCon suppliers commonly back their modules with a 30-year linear performance warranty and a Zero LID guarantee. That combination satisfies bank and NBFC lender bankability requirements, which matters when you finance a project.
Certification adds another layer of assurance. TOPCon products hold ALMM eligibility and BIS certification. Major manufacturers continue to invest in TOPCon capacity, and that commitment supports long-term parts and service availability.
HJT matches or exceeds TOPCon on efficiency, yet it requires new and expensive production equipment. Treat warranty length and lender acceptance as signals of bankability, not as a ranking. Ask each supplier for written terms before you commit.
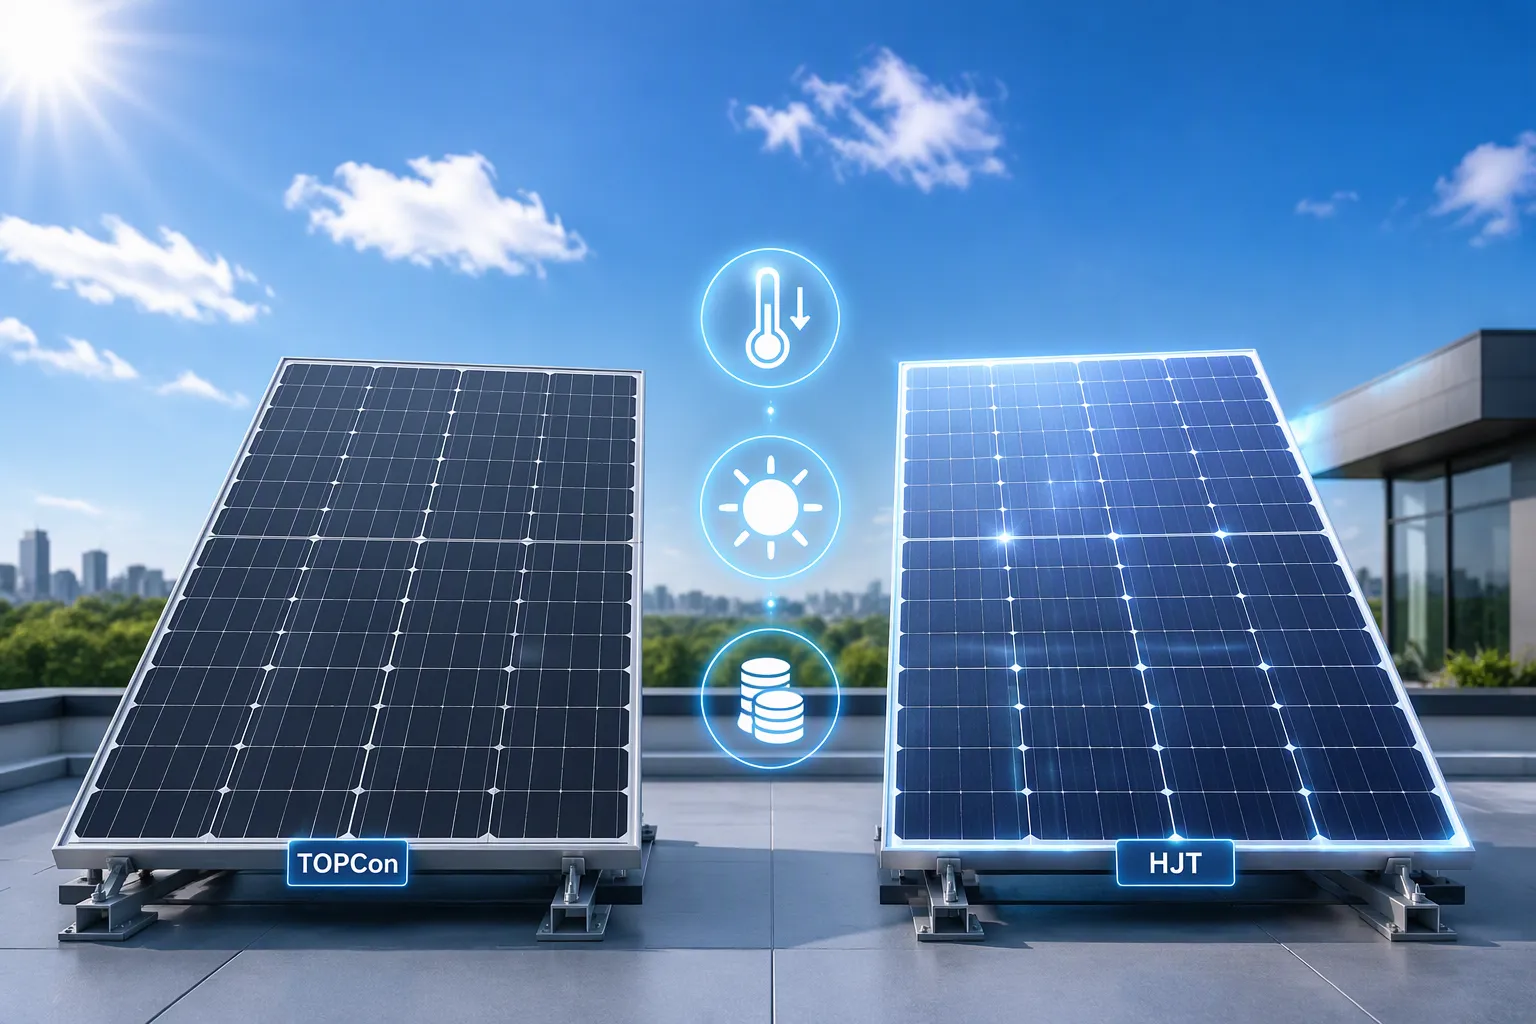
You now have the individual pieces. This table puts them in one place, so you can weigh the trade-offs at a glance. Every figure below comes from published product data and market pricing. Treat the ranges as indicative, not as fixed specifications.
|
Feature |
N-Type TOPCon |
N-Type HJT |
|---|---|---|
|
Manufacturing maturity |
Very mature; widespread capacity, domestic supply under ALMM/DCR |
Rapidly growing; limited domestic supply |
|
Module efficiency (STC) |
22–24%+ |
23–25%+ |
|
Temperature coefficient |
−0.29%/°C |
−0.24 to −0.26%/°C |
|
Bifaciality factor |
Higher bifaciality factor |
Compatible with bifacial designs |
|
Year-1 degradation |
~1% |
~1% |
|
Linear annual degradation |
0.35–0.50%/year |
0.25–0.40%/year |
|
Indicative cost (India, 2026) |
₹24–26/Wp |
₹28–32/Wp |
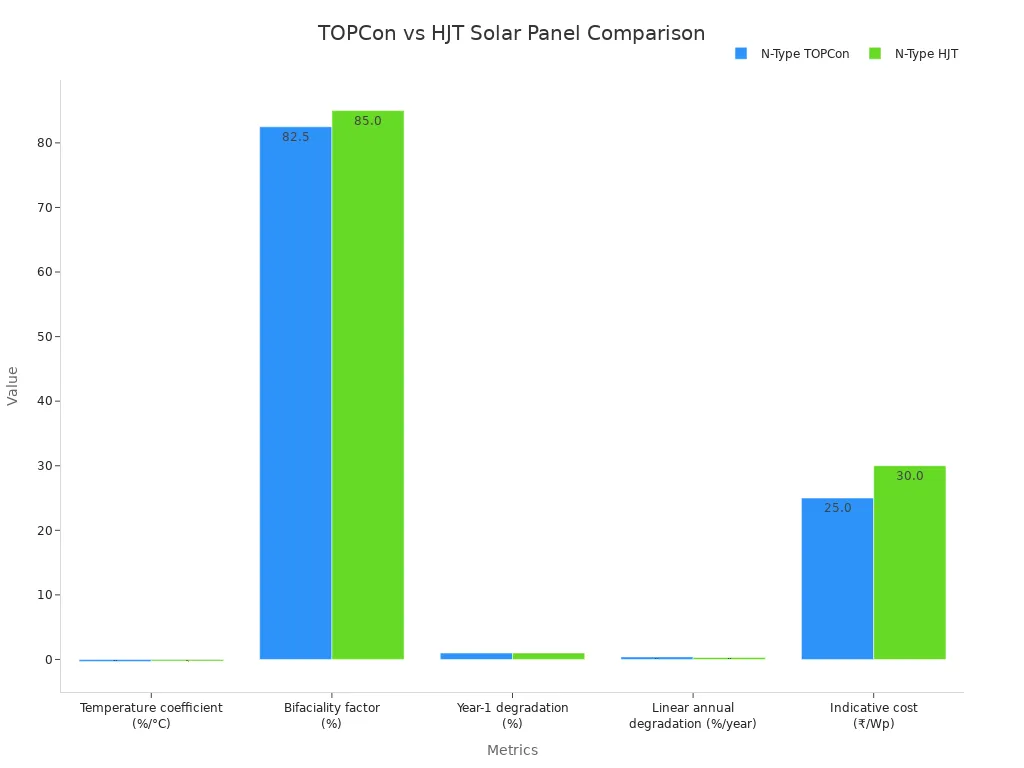
Read the rows as trade-offs, not as scores. HJT wins on module efficiency, temperature coefficient, bifaciality, and annual degradation. TOPCon wins on manufacturing maturity and cost per watt. Year-1 degradation is effectively a tie at about 1% for both.
The cost row deserves context. HJT carries a premium of roughly ₹4–6 per watt-peak over TOPCon in the Indian market. That premium buys you a higher-efficiency module, a lower temperature coefficient, and slower long-term degradation. Whether the premium pays back depends on your climate, your available area, and your financing terms.
The maturity row matters for procurement risk. TOPCon supply is widespread and includes domestic capacity that meets ALMM and DCR requirements. HJT domestic supply remains limited, so lead times and sourcing options are narrower.
No universal winner exists in this N-Type TOPCon vs HJT Solar Panels comparison. A project in a hot climate with high land costs may justify the HJT premium. A large utility or commercial project with tight capital budgets often favors TOPCon. Use the table to frame your own calculation, then test both options against your site data.
Heat separates these two technologies more than any lab rating does. HJT holds a temperature coefficient of -0.24% to -0.26% per degree Celsius. TOPCon runs -0.29% to -0.32%. That gap changes real output once cell temperatures climb.
|
Metric |
N-Type TOPCon |
HJT |
|---|---|---|
|
Power loss at 65°C cell temperature |
11.6–12.8% |
9.6–11.2% |
|
Weighted annual temperature loss |
~5.9% |
~5.3% |
|
Performance ratio |
~91% |
~92% |
A 10 kW system in Tunis shows how this plays out. TOPCon produces about 18,400 kWh per year. HJT reaches roughly 18,650 kWh, a gain of 250 kWh or 1.4%. Compare both against PERC and the N-type advantage grows clearer: TOPCon adds about 800 kWh per year (4.5%), while HJT adds about 1,050 kWh (6.0%).
In hot climates, N-type TOPCon panels outperform P-type PERC by roughly 4-5% in annual energy yield under North African and Middle Eastern conditions, while HJT panels add another 1-2% — but at a notably higher price.
That premium runs 15-30% over TOPCon. Weigh it against a 1.4% yield gain before you commit.
Bifacial gain rewards sites with bright, reflective ground. TOPCon vs HJT bifaciality favors HJT slightly, and bifacial solar module performance depends on albedo, mounting height, and tilt as much as on the cell. Snow, white gravel, and light concrete lift rear-side output for both technologies.
On a tight roof, every square meter counts. HJT's higher module efficiency packs more watts into the same area, so TOPCon vs HJT energy yield tilts toward HJT when area is the binding limit. On open land, HJT vs TOPCon power output differences shrink in importance, and installed cost dominates the decision.
Match the module to the site. Measure albedo and roof area first, then compare the two options on lifetime kilowatt-hours.
Money talks first. TOPCon modules run roughly $0.25–$0.35 per watt. HJT carries a 10–20% premium, and that gap is narrowing as production scales. The factory side explains the spread. Converting a PERC line to TOPCon costs about $30–40 million per GW per year. HJT needs an entirely new facility at $80–120 million per GW for low-temperature deposition equipment.
|
Panel Type |
Initial Cost ($/W) |
25-Year LCOE |
|---|---|---|
|
N-Type TOPCon |
$0.30 |
$0.038/kWh |
|
N-Type HJT |
$0.35 |
$0.036/kWh |
Notice the reversal. HJT costs more today, yet its 25-year LCOE comes in lower. That is the heart of any TOPCon vs HJT cost analysis. A 5 MW commercial system shows the same pattern. Choosing TOPCon at $0.30/W over PERC at $0.22/W adds about $400,000 to the initial bill. That system then generates $1.2–1.6 million more in lifetime energy over 30 years. Solar module lifecycle cost rewards patience, not the lowest quote.
Site conditions decide whether the HJT premium earns its keep. In hot climates, HJT produces 5–8% more annual energy. That gain narrows the upfront gap and lowers LCOE by 12–18% over 25 years.
A normal-sized rooftop tells a different story. A homeowner in Indore or Bhopal rarely recovers the HJT premium. A typical residential TOPCon premium justifies itself in about 9 years, within a 25-year system life. The HJT premium takes roughly 12 years. Run a TOPCon vs HJT ROI model on a space-constrained roof or a premium build, and the economics shift toward higher efficiency. Where space is not a constraint and upfront cost matters, the cheaper option wins. Match the module to the constraint that binds your project.

Start with your climate. Extreme heat with summers above 95°F rewards HJT, which balances efficiency and heat tolerance when space is tight. A hot site with limited roof area also favors HJT, TOPCon, or premium N-type options, because high efficiency plus good temperature behavior maximizes power per square foot. When space is ample, HJT remains a strong pick for long-term output.
Humidity and salt air change the picture. Coastal and hot-humid sites suit HJT, which resists moisture-related degradation. Budget-focused hot climates lean toward TOPCon. It delivers strong heat performance, and its cost keeps improving as production scales. Commercial buildings with aesthetic demands call for premium N-type products with uniform black appearance and 30-year warranties.
Your budget sets the second filter. A tight capital budget points to TOPCon for large-volume deployment. A premium budget opens HJT for maximum yield. Neither choice is wrong. Each fits a different constraint.
Project type narrows the decision further. The table below maps each technology to its best-fit applications.
|
Technology |
Best-Suited Project Types |
|---|---|
|
N-Type TOPCon |
Utility-scale plants; C&I rooftop projects; large-volume deployment; ROI and LCOE-focused projects; ground-mounted bifacial projects |
|
HJT |
High-temperature regions; desert projects; snow or high-reflection environments; premium utility-scale projects prioritizing maximum energy yield |
TOPCon also covers industrial and manufacturing plants, agricultural solar, solar-plus-storage hybrids, commercial rooftops, and EPC turnkey work. Wattage class guides the match. Modules at 550W–600W suit distributed generation on commercial rooftops and small industrial systems. The 600W–650W band fits C&I systems and EPC contracts. Large C&I rooftops and industrial parks take 650W–700W. Utility plants use 700W–720W, and gigawatt-level projects run 720W and above.
Use this N-Type TOPCon vs HJT Solar Panels framework as a starting filter. Confirm the final choice against your site data, your tariff structure, and your financing terms.
Start with a solar module datasheet comparison across shortlisted products. Verify the module efficiency, bifacial factor, temperature coefficient, and year-one and annual degradation figures. Set clear thresholds: module efficiency of at least 23.5%, a bifacial factor of at least 85%, and warranty terms of at least 80% output at 30 years. Run a solar panel degradation rate comparison and a solar module warranty comparison side by side, then feed the TOPCon-specific parameters into your energy-yield model for accurate LCOE results.
Confirm certifications and test reports in writing. Ask for PID resistance data, damp-heat and salt-mist results where your site demands them, and proof of eligibility for your destination market. A single sample cannot represent every production batch, so pair the sample with batch-level quality-control records.
Judge a TOPCon solar module supplier on evidence, not on sales presentations. Check factory capacity, production records, and quality-control procedures. Confirm warranty terms, replacement procedures, and response times in writing, and tie payment milestones to inspection and shipping documents. Ask whether the N-type solar module manufacturer has shipped to your market before, since paperwork errors can delay shipments for weeks.
|
Supplier Profile |
Annual Module Capacity |
Warranty Structure |
Key Buyer Checks |
|---|---|---|---|
|
Profile A |
30–50 GW |
12–15 yr product; up to 30 yr performance |
Bankability, serial-number traceability |
|
Profile F |
10–25 GW |
12–15 yr product; 30 yr options |
Damp-heat data, salt-mist testing |
Suppliers compete on equal terms, and selection rests on fair evaluation of quality, price, delivery, after-sales service, and stable supply.
Weigh installation conditions, spare inventory, and local technical skills alongside efficiency ratings. This checklist applies to any solar panel technology for utility-scale projects, and it matters just as much in the N-Type TOPCon vs HJT Solar Panels decision.
PNG Solar builds its N-Type TOPCon line around the three project types this article has already mapped. Utility-scale plants take the high-wattage modules, where cost per watt and bankability drive the decision. Commercial and industrial rooftops sit in the middle bands, and those sites reward a balance of efficiency and upfront price. Distributed projects, including residential and small industrial systems, use the lower wattage classes.
You can match a module to your project without guesswork. The 550W–600W class suits distributed generation on commercial rooftops and small industrial systems. The 600W–650W band fits C&I systems and EPC contracts. Large C&I rooftops and industrial parks take 650W–700W, while utility plants use 700W–720W and above. Each product page lists the application scenarios for that class, so you can confirm the fit before you shortlist.
Request the datasheet first. Check module efficiency, bifacial factor, temperature coefficient, and the year-one and annual degradation figures against the thresholds set out in the procurement checklist above. Ask for batch-level quality-control records alongside the sample, since one sample cannot represent every production run.
Three inquiry routes keep the process simple. Ask for a datasheet pack to compare specifications across wattage classes. Request a sample for inspection and testing. Send your project details, including site location, climate, available area, and budget, to receive a project-specific recommendation. Share your timeline as well, so the team can confirm lead times against your schedule.
HJT wins on efficiency, slower degradation, and heat performance when your budget allows. TOPCon wins on proven cost-effectiveness, mass-production maturity, and broad project fit.
Your climate, land or roof area, budget, financing requirements, and timeline decide the better option. This N-Type TOPCon vs HJT Solar Panels choice has no universal winner.
Request datasheets or a project-specific recommendation to finalize your pick.
Expect roughly one percentage point at module level. HJT modules reach 23–25%+, while TOPCon modules land at 22–24%+. The gap widens on cell ratings and narrows once panels are assembled.
HJT holds output better. Published rates put HJT near 0.30% per year and TOPCon near 0.40% per year. By year 25, that difference becomes measurable megawatt-hours on a large array.
It depends on your site. HJT carries a premium of roughly ₹4–6 per watt-peak in India. Choose it when heat, limited area, or high land costs make extra yield valuable. Otherwise, TOPCon usually wins on payback.



Inscrivez-vous à notre newsletter pour obtenir des informations de mise à jour, des promotions et des informations.

 Envoyez-nous un email
E-mail : [email protected]
 Appelez-nous
Tél : +8615606821994
Whatsapp : +8615606821994
 Adresse
No.6, Linquan East Road,Feidong New City Economic Development Zone, 231600 Hefei ,Anhui Province PRC.
© Hefei Pinergy Solar Technology Co., Ltd .Tous les droits sont réservés
. Plan du site
| Blog | XML | politique de confidentialité
 RÉSEAU PRIS EN CHARGE


